
I went looking for research on how church leaders discover and evaluate software.
It does not exist.
I checked Barna, Lifeway, Hartford and the National Congregations Study. Every "X% of pastors find software through Y" claim I chased traced back to a vendor blog with no method behind it.
That's worth knowing before you plan a year of marketing around somebody else's channel advice. What follows is what you can actually verify, and where the guesswork starts.
The One Real Finding On How Churches Choose
Barna and Pushpay surveyed 1,306 church leaders in November and December of 2025. Their finding on adoption is short: ease of use, price and reputation remain the primary drivers for adopting new tools.
Check the method before you lean on it. 644 participants came from Pushpay's networks and 661 from Barna's, with no margin of error published, which makes it a list-recruited sample split between a vendor's customer base and a research firm's panel. It's the best thing available on this question and it isn't a probability sample.
The same study found 97% of churches use social media, 86% use live streaming, and 60% of leaders personally use AI at least monthly while only 33% say their church uses it for ministry operations.
Who You Are Actually Selling To
The National Congregations Study is the methodologically strongest source in this market. Wave IV covered 1,262 congregations in a nationally representative sample run out of Duke.
Weight that same data by attendance, and the median churchgoer sits in a church with 3 full-time staff.
That split is the channel problem. Most churches are too small to buy anything, while most churchgoers sit in churches that can afford you, so any channel reaching congregations evenly is spending most of its money on people who cannot buy.
The fieldwork is from 2018 and 2019, so treat the exact figures as a few years stale. The structure hasn't changed.
5 Church Channels You Can Price From Published Numbers
The Conference Floor
This is the most transparent channel in the market, because organizers have to publish something to sell booths.
NRB's 2026 convention drew more than 5,700 attendees and more than 240 exhibitors across 56,000 square feet in Nashville. Their current booth pricing is not published. Their last public rate card, the 2023 prospectus, listed $28 per square foot for non-members, which put a 10 by 10 booth at $2,660 standard or $1,862 early bird. Treat that as a 3-year-old anchor.
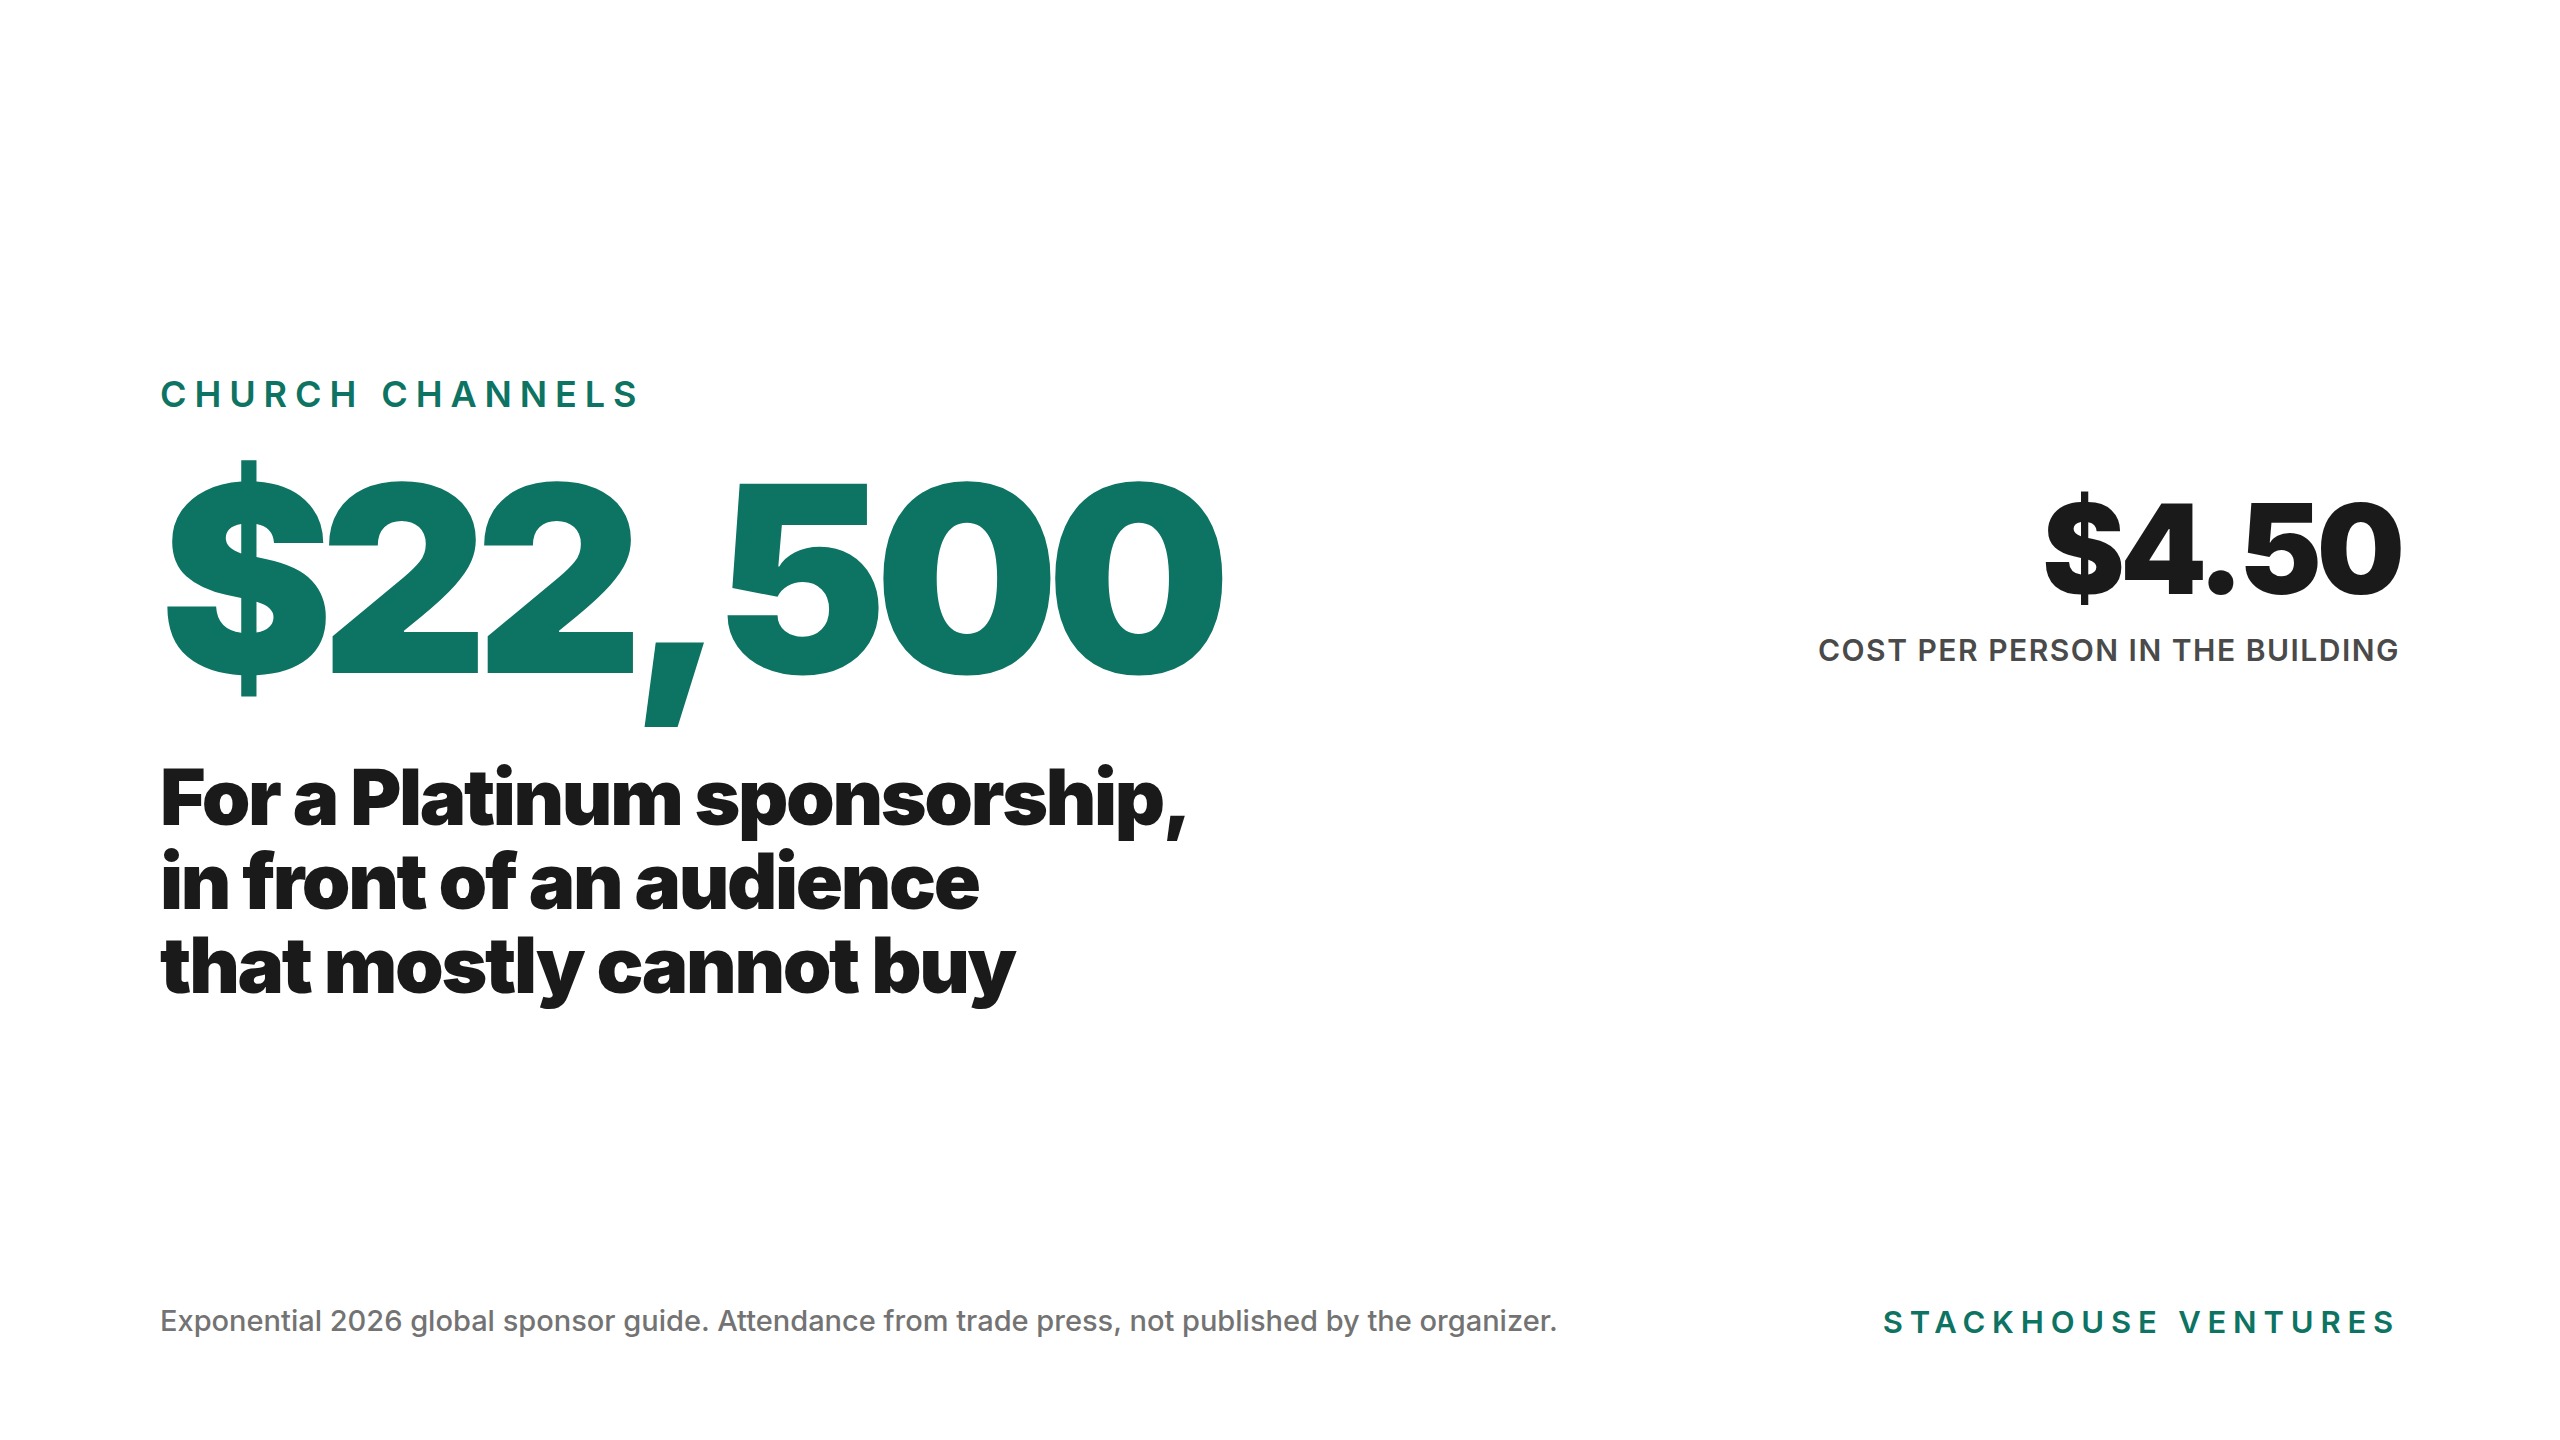
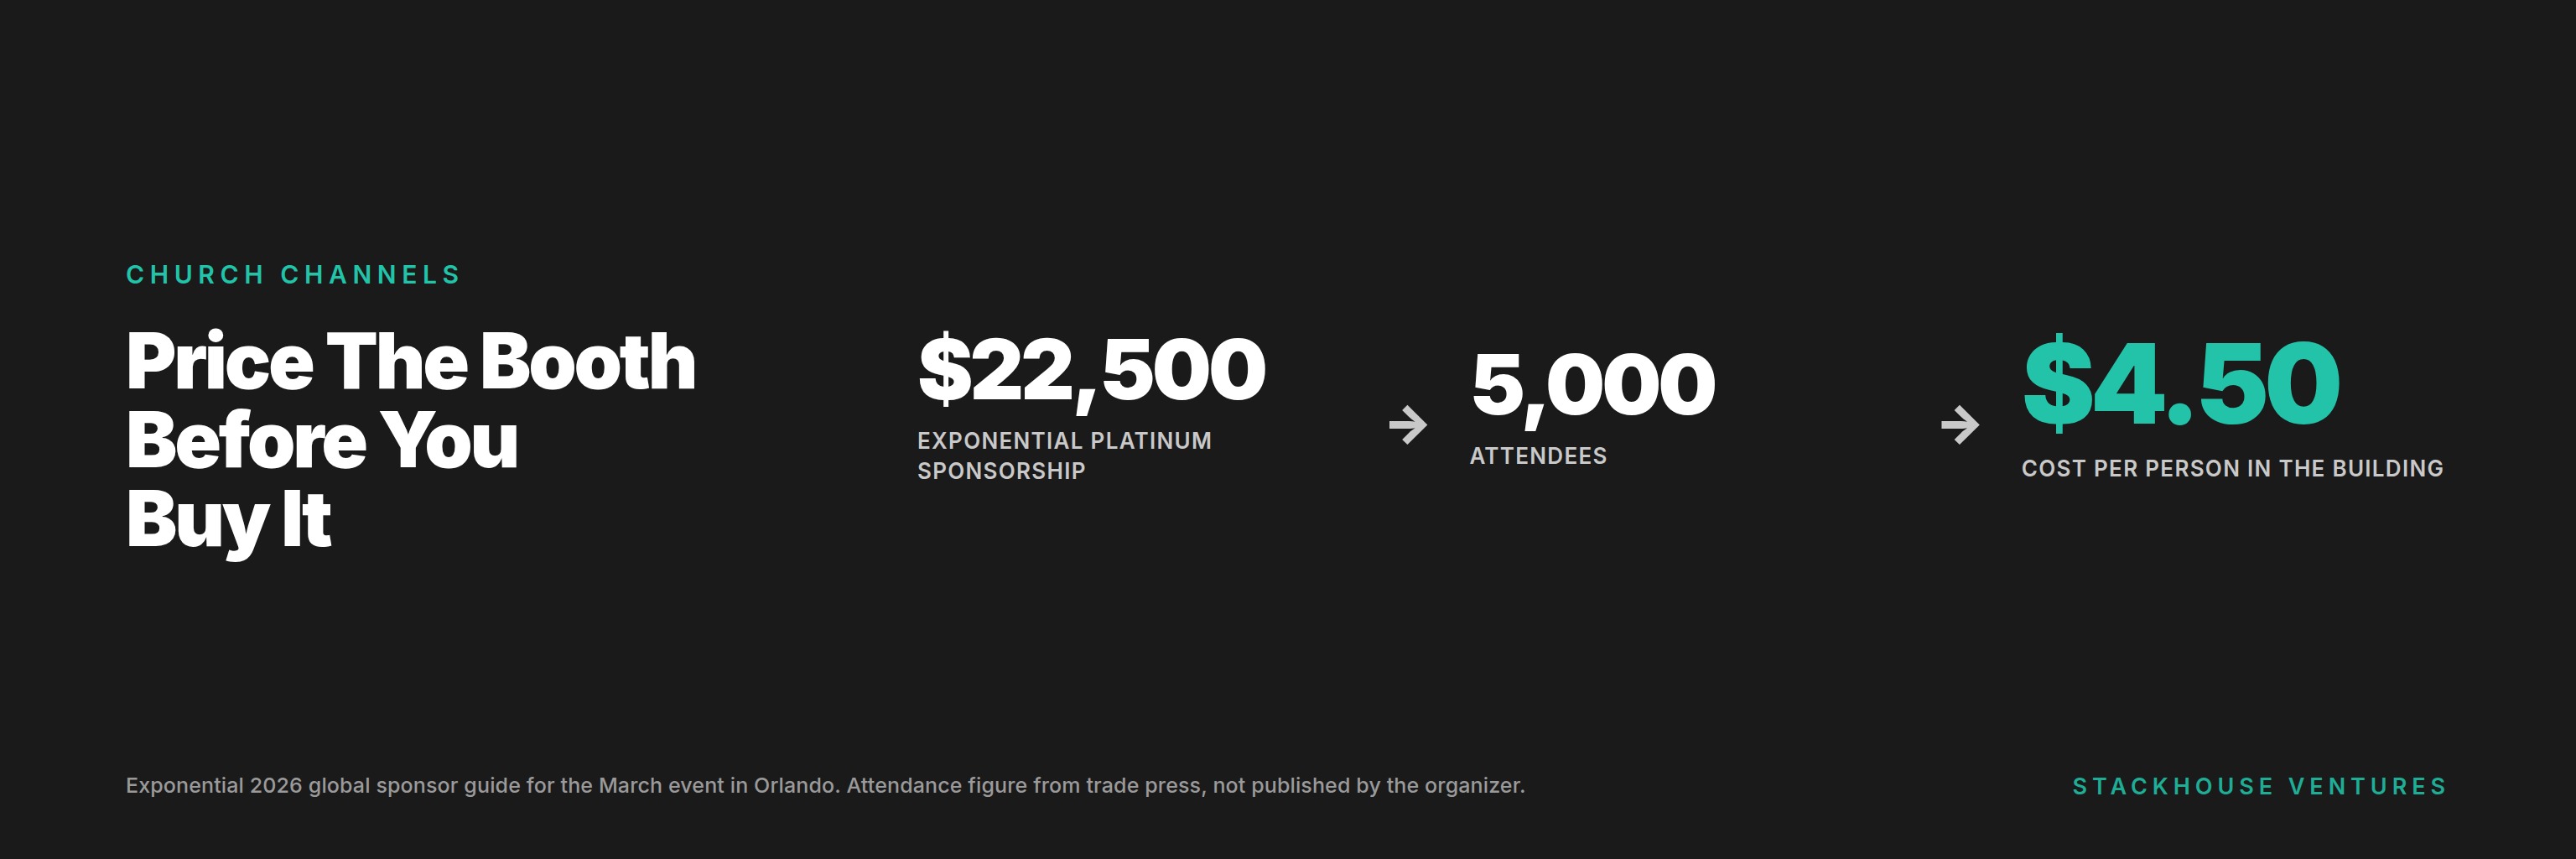
Exponential publishes real sponsor prices: Platinum at $22,500 and Gold at $6,000 for their March event in Orlando, which trade press put at around 5,000 attendees. There is no booth-only price in the guide.
CFX reported over 1,100 registrations and nearly 150 exhibitors in 2025, and publishes no booth pricing either.
Christian Leadership Alliance's 2026 program book lists 46 booth numbers and describes "over 50 experts and service providers." No attendance figure, no rate card.
Divide the sponsorship cost by attendance and you get a cost per person in the building. Platinum at Exponential works out to about $4.50 an attendee, and almost none of those attendees are your buyer. Run that arithmetic before you commit, because a booth is the easiest way I know to spend $15,000 in this market without a single qualified conversation.
The Denominational List
This is the channel with the best published sizing data, because denominations count themselves.
The 2020 U.S. Religion Census enumerated congregations from 372 religious bodies. The Southern Baptist Convention showed 51,379 congregations, non-denominational churches 44,319, and the United Methodist Church 30,051.
Those numbers move. Lifeway put the SBC at 46,608 affiliated congregations in 2025, a different counting method plus real decline. The UMC figure predates the disaffiliations of 2022 and 2023 entirely, so do not quote 30,051 as a current number.
Before you build a denominational strategy, check whether the door is open. The SBC annual meeting drew 11,692 messengers and 21,144 total attendance in 2026, and its exhibit hall is gated: primary exhibitor status is reserved for SBC entities, state conventions, and Baptist-affiliated schools. A for-profit software company is a vendor exhibitor, approved case by case.
Church Media And Newsletters
Almost nobody in this category publishes a rate card. That absence is itself the finding.
Christianity Today's advertising site claims engagement with more than 4.5 million Christian leaders monthly, 395,000 opt-in email subscribers, and 1.25 million monthly unique visitors. No rates, no CPM, no audit body named.
Outreach Media Group publishes no audience numbers and no rates, only an offer of custom proposals.
Church Communications publishes a full ladder: quarterly sponsorships from $500 to $1,500, roadshow packages at $1,500 and $3,500, and their ComCon conference at $1,000 to $10,000. They describe a community of over 20,000 church leaders and say roadshow attendance is expected at 25 to 50 people per city. Publishing an expected attendance of 25 is unusually honest for this category, and it lets you do the math before you buy.
Disclosure: ChurchTechToday, which publishes partner rates at $300 and $700 a year against a claimed 200,000 annual ministry leaders, is owned by Stackhouse Ventures.
When a publisher won't tell you the audience size or the price, that's a data point about the channel, and it isn't a reason to call for a proposal.
Integration And Platform Partnerships
Planning Center, Tithe.ly, Subsplash and Ministry Brands all sit between you and the churches you want. An integration listing puts you in front of buyers who have already proven they will pay for software, which is a filter no ad can replicate.
There's no published data on what these partnerships produce. What you can verify is who has the customers, and the platforms publish enough about their own pricing tiers to tell you which ones serve churches at your target size.
You pay for this one in engineering time, and the payoff arrives over quarters. Price it as a product decision.
The Customers You Already Have
Nobody has measured peer referral among pastors. I looked hard. Barna's "reputation" finding is the nearest thing, and reputation is a different construct.
So this channel is unmeasured, which means you have to measure it yourself. That's a 20-minute job. Go through your last 20 customers and write down where each one came from.
You'll find out whether referral is your best channel or a story you've been telling yourself. Either answer is worth more than the entire body of published research on this question, because it's about your product.
What To Do With A Market Nobody Has Studied
The absence of research isn't a reason to guess. It's a reason to run every channel as an experiment with a fixed budget and a stopping rule.
Pick 2 channels. Give each one a number you are willing to lose and a date. Track cost per qualified conversation and ignore impressions.
In a market where the median congregation has one full-time employee and 78% of churchgoers sit in the largest 13% of churches, the channel that works is almost always the one reaching the big end. Everything else fills your funnel with people who can't buy.
Your Assignment This Week
Take your last 20 customers and build a 3-column table.
- Where did this customer first hear about you?
- What did that channel cost, including your time getting there?
- How long from first contact to signature?
Sort by column 2 divided by the number of customers each channel produced. That's your real cost per customer by channel, and it'll almost certainly contradict where your budget went last year.
If you want to be in a room with founders comparing what actually worked in this market, that is what the Builder Conference is. Jackson Hole, this November.
Where did your last 5 customers actually come from?
Sources and Further Reading
- National Congregations Study, Wave IV summary tables. 1,262 congregations, nationally representative, Duke University. The staffing data is the best in the field.
- Barna, on church technology and mission, March 2026. 1,306 church leaders with Pushpay. Read the methodology note before you cite it.
- 2020 U.S. Religion Census, Quick Answers. Congregation counts by denomination, county by county.
- Lifeway, Southern Baptist annual church profile 2025, May 2026. Note the 61% reporting rate.
- NRB 2026 convention attendance and the 2023 exhibitor prospectus, the last published rate card.
- Exponential 2026 sponsor guide. Real prices, and audience claims with no stated method.
- SBC annual meeting exhibitor policy. Read this before planning a denominational conference strategy.
- Church Communications partner rates. The most transparent rate card in the category.
- Hartford Institute, Fast Facts on American Religion. Where the congregation and attendance concentration figures come from.