
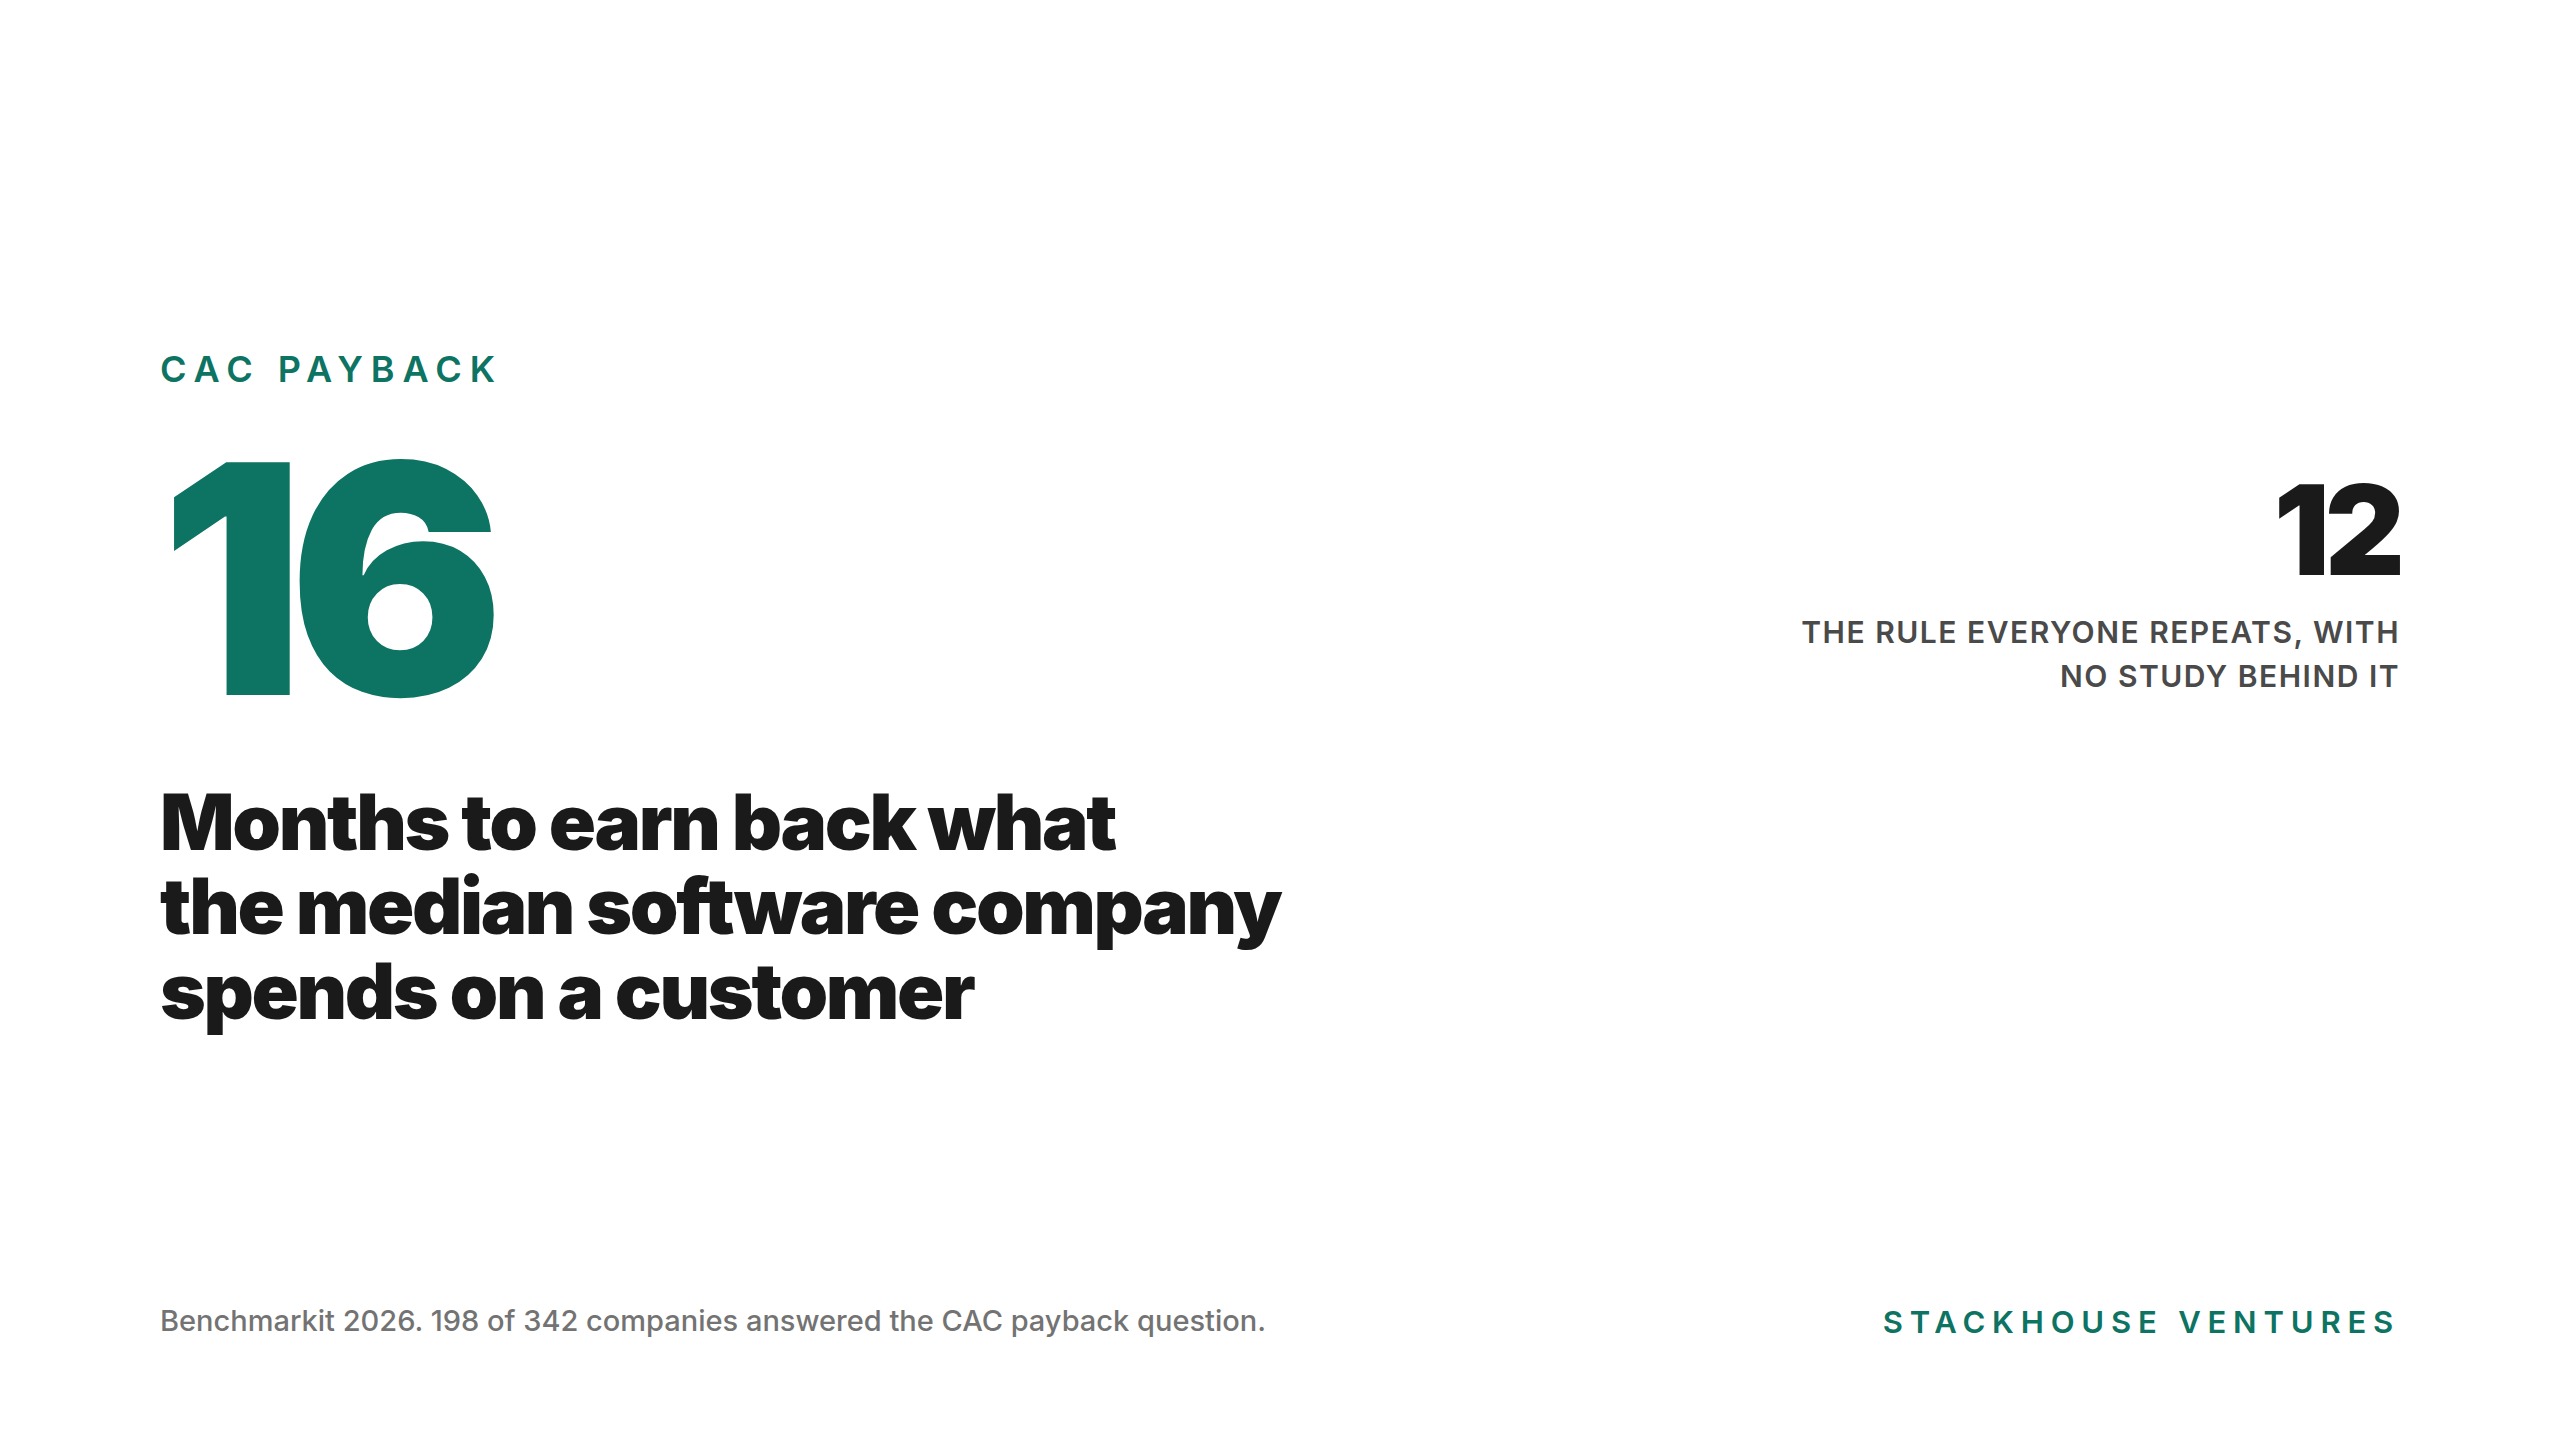
Somebody has told you your customer acquisition cost should pay back in 12 months.
I went looking for the study behind that number. There isn't one.
The best evidence of that comes from Benchmarkit, the firm that surveys hundreds of software companies on exactly this metric every year. In their own report, they call it "Common wisdom" and then immediately note that contract size is what drives the metric.
When the people who collect the data describe your benchmark as common wisdom, that is your answer.
Where 12 Months Actually Came From
Two things produced it, and neither is research.
The first is David Skok's work on SaaS metrics. Skok is the investor whose essays are where most of the standard software formulas originated, and his version is much tighter than what people repeat. Skok wrote that "many of the best SaaS businesses are able to recover their CAC in 5-7 months" and that profitability gets thin past 12. He also says plainly that enterprise businesses can run at 20 months and work fine.
The second is arithmetic. Ben Murray, who publishes as The SaaS CFO, points out that a magic number of 1.0 "implies that you paid back your customer acquisition costs in a one year timeframe".
So 12 months is a round number that falls out of another round number. That is the whole provenance.
What The 2026 Benchmarks Actually Say
Benchmarkit's 2026 report surveyed 342 software companies, with 198 answering the CAC payback question. Data covers calendar year 2025.
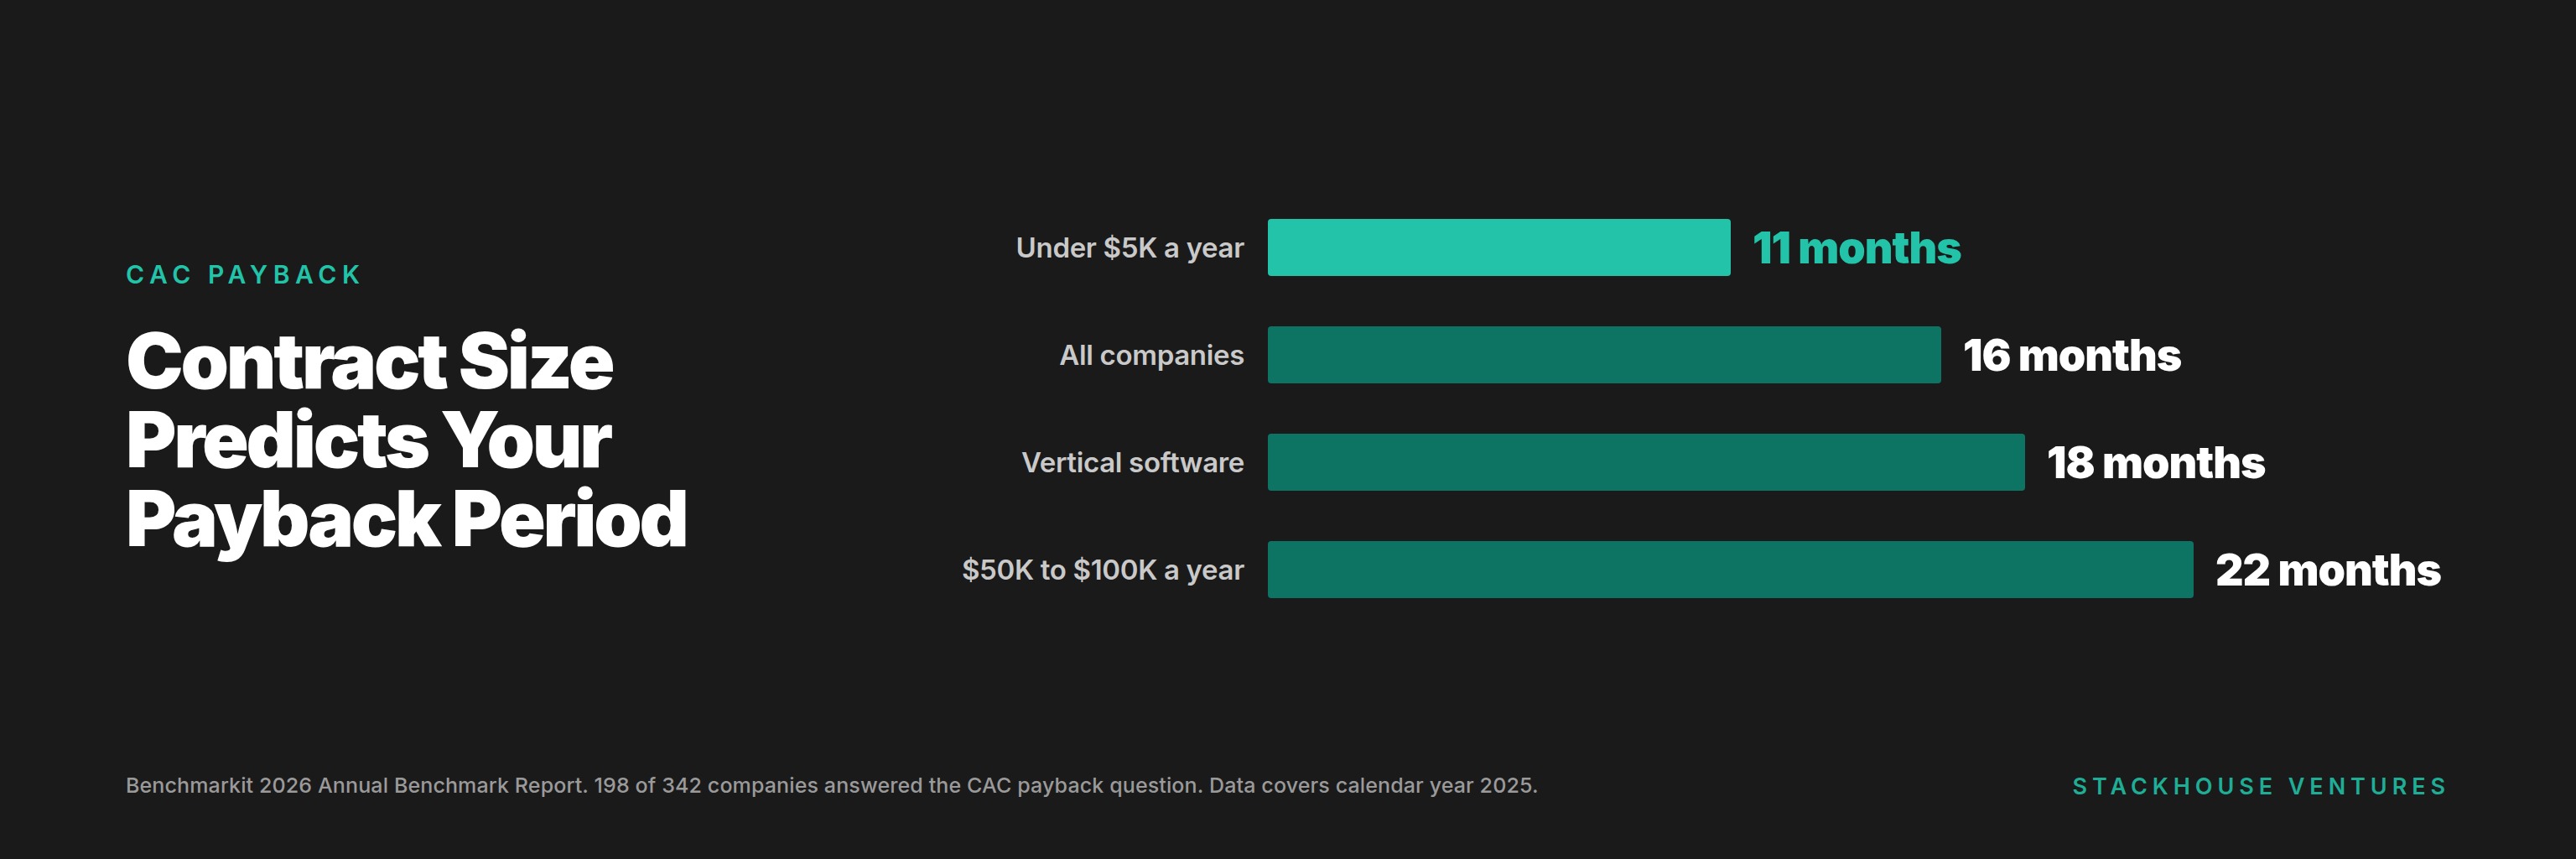
The median CAC payback period is 16 months. The 25th percentile is 10 months.
The trend is more interesting than the median. It ran 14 months in 2023, worsened to 18 months in 2024, then recovered to 16 in 2025.
Two cuts of that data matter more to you than the headline.
Vertical software companies carry an 18-month median against 14 months for horizontal software. Selling to one industry costs more per customer, which is the tradeoff that comes with knowing your buyer cold.
And the ACV split is where this gets useful. Companies with contracts under $5,000 a year show an 11-month median payback. Companies at $50,000 to $100,000 show 22 months.
Bessemer Venture Partners is one of the oldest venture firms in the country and publishes the most widely used free operating benchmarks in software. They say the same thing in plainer language: "CAC payback periods for SMB customers should be approximately 6-18 months whereas enterprise customers can be as long as 24-36 months." That is stated investor guidance with no sample size behind it, so treat it as a named firm's recommendation and not as measured data.
What The Benchmarks Do Not Cover
Benchmarkit does not segment CAC payback by company size at all. Their smallest revenue band is under $5 million, and the payback metric is cut by contract value instead.
SaaS Capital's smallest published band is $1 million to $3 million in ARR, and they don't publish a CAC payback metric.
So if you're at $300,000 a year, no published benchmark describes you. That's worth saying out loud, because most articles on this metric imply otherwise without ever checking.
The rescue is in Benchmarkit's own methodology note. They say CAC payback "should be evaluated in context of the company attribute most correlated to the metric's performance, which is Annual Contract Value."
You have an ACV. Divide your revenue by your customer count and you can compare yourself to a band you actually belong in.
5 Steps To Calculate CAC Payback At Your Size
Find Your Monthly Revenue Per Customer
$300,000 across 60 customers is $5,000 a year, or $417 a month.
That also tells you which benchmark band you're in. At a $5,000 ACV you're at the bottom of Benchmarkit's lowest band, where the median payback is 11 months.
Most church software sits well below even that. Breeze charges $72 a month, which is an $864 ACV. Tithe.ly's church management plan is the same. Text In Church starts at $37. If your average church pays you $1,200 a year, you are deep inside the lowest band anybody publishes. Compare yourself to 11. The 16-month figure describes a different set of companies, and the 12-month rule describes nothing anybody ever measured.
Multiply By Your Gross Margin
This is the step everybody skips, and skipping it flatters you by roughly a quarter.
Benchmarkit, Bessemer, and Ben Murray all define CAC payback on a gross-margin-adjusted basis. Murray's formula is CAC divided by monthly revenue per customer times gross margin percentage. Benchmarkit's 2026 median software gross margin is 80%.
At $417 a month and an 80% margin, you're earning $333 a month of gross profit per customer. That's the number that pays back your acquisition cost.
If you compute payback without the margin adjustment and then compare yourself to a published benchmark, you're comparing 2 different metrics.
Add Up Everything You Spent Getting Customers Last Year
Count everything whose purpose was to produce a customer:
- Ad spend and paid placements
- Conference booths, sponsorships, and the travel to get there
- Contractors and agencies doing outreach or content
- Your CRM, email tool, and anything else in the sales stack
Then add the part everybody leaves out: your own time. If you spent half your year selling, half your salary belongs in this number. If you don't pay yourself, put in what you'd have to pay someone to do it.
Leaving founder time out is the single most common way a small company's CAC gets understated, and it is how founders convince themselves acquisition is free.
Divide By New Customers Added
$60,000 of selling effort across 20 new customers is a CAC of $3,000.
Count only the customers you added. Renewals didn't cost you acquisition money.
Divide CAC By Monthly Gross Profit
$3,000 divided by $333 is 9 months.
That is your number. Against an 11-month median for your ACV band, 9 is good. You now know something specific about your business that the 12-month rule could never have told you.
Run it once a quarter. The direction matters more than the absolute figure at your size, because with 20 new customers a year a single unusual deal moves the average a lot.
What Sets Your Acquisition Cost In The Church Market
Two things drive your number here and neither one appears in a software benchmark.
The first is that the buying market is small. Hartford Institute counts about 373,000 congregations, with the largest 13% holding 78% of all churchgoers, so roughly 48,000 churches have the staff and budget to buy anything. You cannot spend your way past that number.
The second is that the channels cost a lot per head. Exponential's Platinum sponsorship runs $22,500. Against a $1,200 ACV, that one sponsorship has to produce 19 new churches just to cover its own fee in year one, before travel, booth staff, or the year you wait for the deals to close.
That arithmetic is why referral and denominational relationships are worth more in church software than they are in almost any other market. They are the only channels whose cost does not scale with the number of customers you win.
Why Moving Halfway Upmarket Costs You
Benchmarkit found something in their data that runs against the usual advice, and they found it more than once.
Their 2025 report notes that "solutions in the $10K - $50K ACV range are often more expensive to acquire than solutions in the $50K - $100K ACV range. This is not a one year exception."
Think about what that means if you're at a $5,000 ACV and somebody is telling you to move upmarket.
Going from $5,000 to $30,000 deals moves you into the least efficient band in the dataset. The deals are big enough to need real sales work and small enough that you can't staff for them properly. Going from $5,000 to $75,000 works better, because at that size the buyer expects a process and will sit through one.
The move that hurts is the half-step. If you're going upmarket, go far enough that the sales motion changes with the price.
Your Assignment This Week
Open a spreadsheet and fill in 4 numbers.
- What is your ACV? Revenue divided by customer count.
- What did you actually spend to acquire customers last year, including your own time?
- How many new customers did that produce?
- What is your gross margin, honestly, after hosting and support?
Then run the division. If your payback is under 12 months, spend more on acquisition, because you have proof the spending works. If it's over 24, the problem is almost always your price, and you should go read what your competitors charge before you buy another ad.
If you want to be in a room with founders comparing these numbers honestly, that's what the Builder Conference is. Jackson Hole, this November.
What did your last 10 customers actually cost you?
Sources and Further Reading
- Benchmarkit, Annual Benchmark Report 2026, June 2026. 342 companies, 198 answering the CAC payback question. The ACV segmentation is the part worth your time.
- Benchmarkit, 2025 B2B SaaS Performance Metrics Benchmarks, May 2025. Where the mid-ACV inefficiency finding lives, and where they call the 12-month rule common wisdom.
- Bessemer Venture Partners, 10 laws of cloud. Law 5 has their SMB and enterprise payback ranges. Stated guidance with no sample size behind it.
- David Skok, SaaS Metrics 2.0. The origin of most of what people repeat about this metric, and more careful than the copies.
- Ben Murray, The SaaS CFO, on CAC payback period and on magic number. The formulas, with worked examples you can copy.
- SaaS Capital, 2026 Spending Benchmarks, June 2026. Selling costs at 15% of revenue and marketing at 8%, across more than 1,000 private companies.